The Energy Flow Monitor displays a overall view of the energy flow in a building.
For this purpose, it combines consumers, producers and storages as well as the grid with the help of the associated meter function blocks.
The meters used and their purpose can be specified in the function block.
Even a large number of meters can be clearly displayed by creating distribution boards and groups, and assigning symbols.
This results in an overall view of the energy balance in the building with extensive display options and statistics in the user interface.

 | The energy flow monitor can display up to 6 objects like meters or groups in a star shape. If there are more than 6 objects (including residual value) in the upper level, they are displayed in a list. |
Table of Contents
Properties↑
| Summary | Description | Default Value |
|---|---|---|
| Configure monitor | - | |
| Source Price Export | Select a Spot Price Optimizer as source for the energy export price or use the parameter. Only objects from the same Miniserver can be selected! | - |
| Source Price Import | Select a Spot Price Optimizer as source for the energy import price or use the parameter. Only objects from the same Miniserver can be selected! | - |
Inputs↑
| Abbreviation | Summary | Description | Value Range |
|---|---|---|---|
| Off | Off / Lock | Pulse (< 200 ms): Outputs are reset / switched off. Pulse (> 200 ms): Block is locked. Dominating input. Pulse (> 500 ms): The name of the connected sensor is used in the user interface. | 0/1 |
Parameters↑
| Abbreviation | Summary | Description | Unit | Value Range | Default Value |
|---|---|---|---|---|---|
| Pre | kWh price export | This parameter is only visible in certain configurations. | Currency | ∞ | 0,2 |
| Pri | kWh price import | This parameter is only visible in certain configurations. | Currency | ∞ | 0,2 |
| CO2 | Kg/kWh for CO2 savings | Kg/kWh | 0...∞ | 0,42 |
Outputs↑
| Abbreviation | Summary | Description | Value Range |
|---|---|---|---|
| Gpwr | Grid power | ∞ | |
| Ppwr | Production power | ∞ | |
| Cpwr | Consumption power | ∞ | |
| Spwr | Energy storage power | ∞ | |
| Ed | Export today | ∞ | |
| Id | Import today | ∞ | |
| Pd | Production today | ∞ | |
| Cd | Consumption today | ∞ | |
| Scd | Self Consumption today | ∞ | |
| Co2d | CO2 today | Calculation of CO2 savings: Co2d = Pd * CO2 The calculation of the number of trees in the user interface is based on the formulas of the Greenhouse Gas Equivalencies Calculator. | ∞ |
| Yd | Yield today | Calculation hourly or when the price changes according to the following formula: Yd = (Pd - Ed) * Pri + Ed * Pre | ∞ |
| Rest | Top Rest Power | Calculated remaining power of the top group | ∞ |
| API | API Connector | Intelligent API based connector. Can link several functions between devices and blocks. API Commands | - |
Value Calculations↑
Examples showing how the values displayed in the app are calculated.
Energy produced
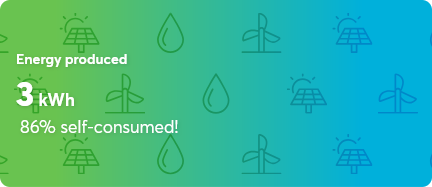
The displayed percentage (86%) shows energy consumed from own sources, not the grid.
CO2 emission saved
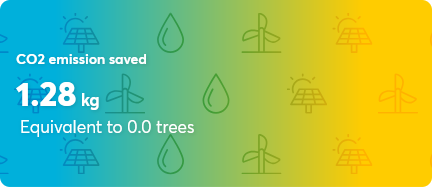
The "Equivalent to trees" value is derived from the saved CO2-emissions (1.28kg) via a fixed calculation.
Money saved

The percentage displayed (8%) is the saving on your electricity bill when compared to a hypothetical bill without self-generated power.
Application Example↑
First, create a meter block for the grid, as well as various meters for consumers or producers.
If available, create a meter block for the storage.
The created meter blocks can then be added and set via the setup dialog (double-click on the function block):

The meters used are arranged according to the installation in the building.
The utility meter or the main meter is often bidirectional and is set as grid.
For the remaining meters, it must be set whether they record consumers or producers.
Storages and Wallboxes also have an integrated meter, and here the type is already fixed.
By dragging a meter onto another meter, the latter becomes a distribution board with subordinate meters.
In the same principle, groups can be created for several devices.
But unlike a distribution board, a group is not a collective meter.
In addition to devices with their own meters, other devices without meters are usually connected to a distribution board. These devices are displayed collectively by the distribution meter as “other”.
Only if all devices connected to the distribution meter are recorded by their own meters, “other” doesnt need to be displayed, since only the sum of the measurement inaccuracies remains.