The recorded values can then be viewed as graphs in Loxone Config and in the user interface (website or app).
CONTENTS:
Activate and configure statistics
View and export statistics in Loxone Config
View statistics in the user interface
Retrieve data using a browser
Delete statistics
Activate and configure statistics
To activate the recording of statistics for an object,
check Statistics and set an Interval:
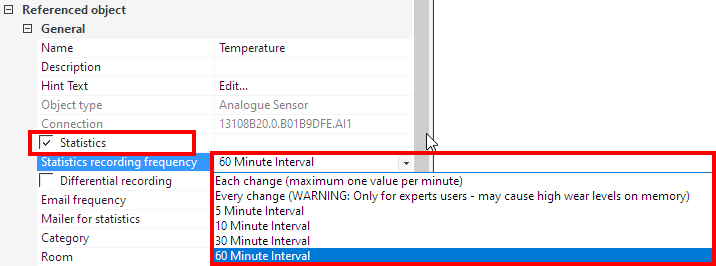
The current value is written to the statistics based on the set interval of one hour.
For example, an interval of 10 minutes should be sufficient for room temperatures.
Average value statistics are no longer available as of Loxone Config 12.0.
An average value can be set for an input under Sensitivity if required:
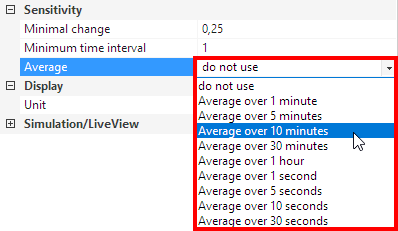
For other objects, the Moving Average block can be used.
Send statistics by email
In order to send statistics by email, set an interval for sending in the properties, and assign a Mailer:
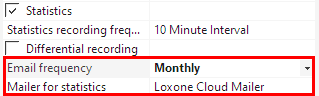
A .csv file containing the statistics is sent by mail at the set interval.
The email’s subject line includes the word “Statistic” and the name of the object, e.g.: “Statistics Temperature”, not the subject of the assigned Mailer.
Type of statistics
For values that are increasing continuously, the Differential recording checkbox can be activated:
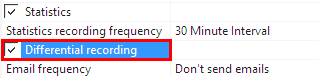
This way, the difference between two consecutive values is recorded instead of the absolute value.
A bar graph will be used for visualization.
Used for consumption data, energy meters, etc.
View and export statistics
The recorded statistics can be retrieved and viewed in Loxone Config.
To do so, select the Miniserver in the periphery tree, and click on Download Statistics:

The statistics window will be opened with the following functions:
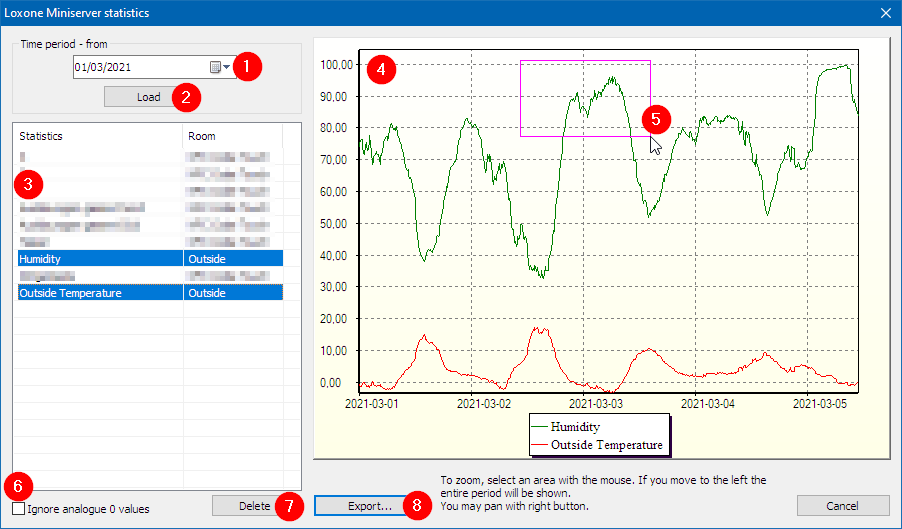
1. Select the starting date for statistics to download.
2. Click on Load to download the statistics from the Miniserver.
3. The loaded statistics are then listed.
Select one or more statistics to view them to the right.
4. In this window the selected statistics are graphically visualized.
5. Click and drag to the right to zoom in on an area of the statistic.
If you drag to the left, the entire statistic will be displayed again.
6. By activating the checkbox, statistics entries that have the value 0 are hidden.
7.With the “Delete” button, all data of the selected statistic(s) are deleted.
8. Export the selected statistics as .csv files and save them to the computer.
View statistics in the user interface
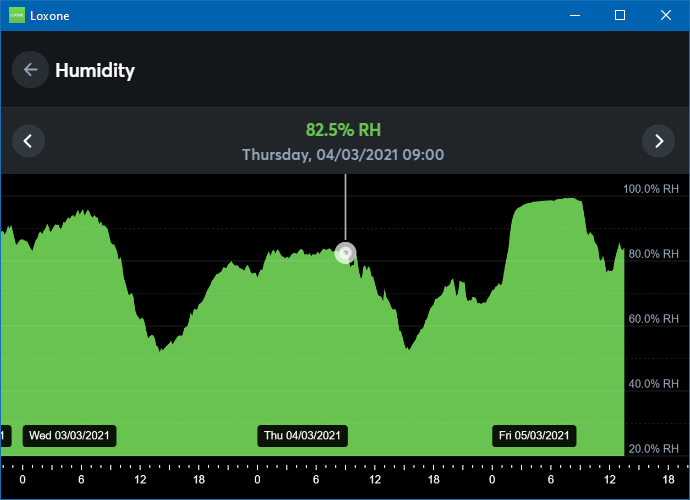
All objects that are used in the user interface and have statistics enabled can be displayed graphically in the user interface.
Example for statistic of the outdoor humidity in the user interface:
Retrieve data using a browser
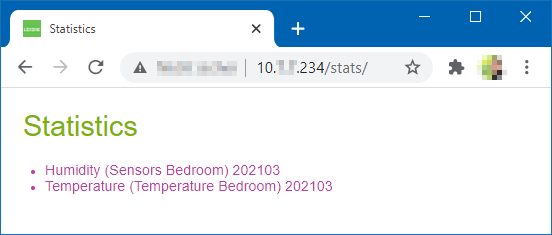
In order to retrieve statistics using a browser, enter the following URL: http://MiniserverIP/stats/
The user is asked to log in, and a list of available statistics is displayed:
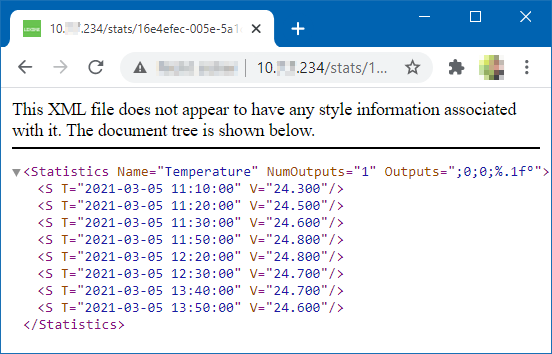
By clicking on a statistic, the data can be displayed in an .xml file:
Delete statistics
If the SD card is full, no more statistics data will be recorded.
In such a case, old statistics should be deleted.
The Manage SD Card function is used to delete statistics.
You can sort the files by date to display the oldest files.
A separate file is created each month for each statistic.
To delete files, select the checkbox for the statistics to delete and click on Delete:
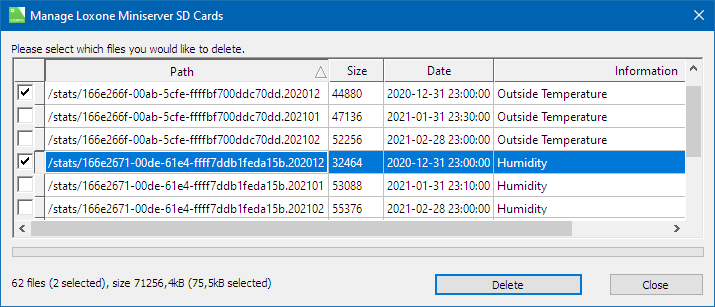
Statistics of the current month are not displayed and cannot be deleted.
To check the memory usage of your SD card, perform the following steps:
- Run the “http://miniserver/dev/sys/sdtest” web service. This takes a few seconds.
- In the response, search for “usage” (used memory of the SD card in %).
- If more than 60% of the memory is occupied, delete old statistics.