Exosphere Update – December 2025
Usability Features
Exosphere Update: All Details in the Video
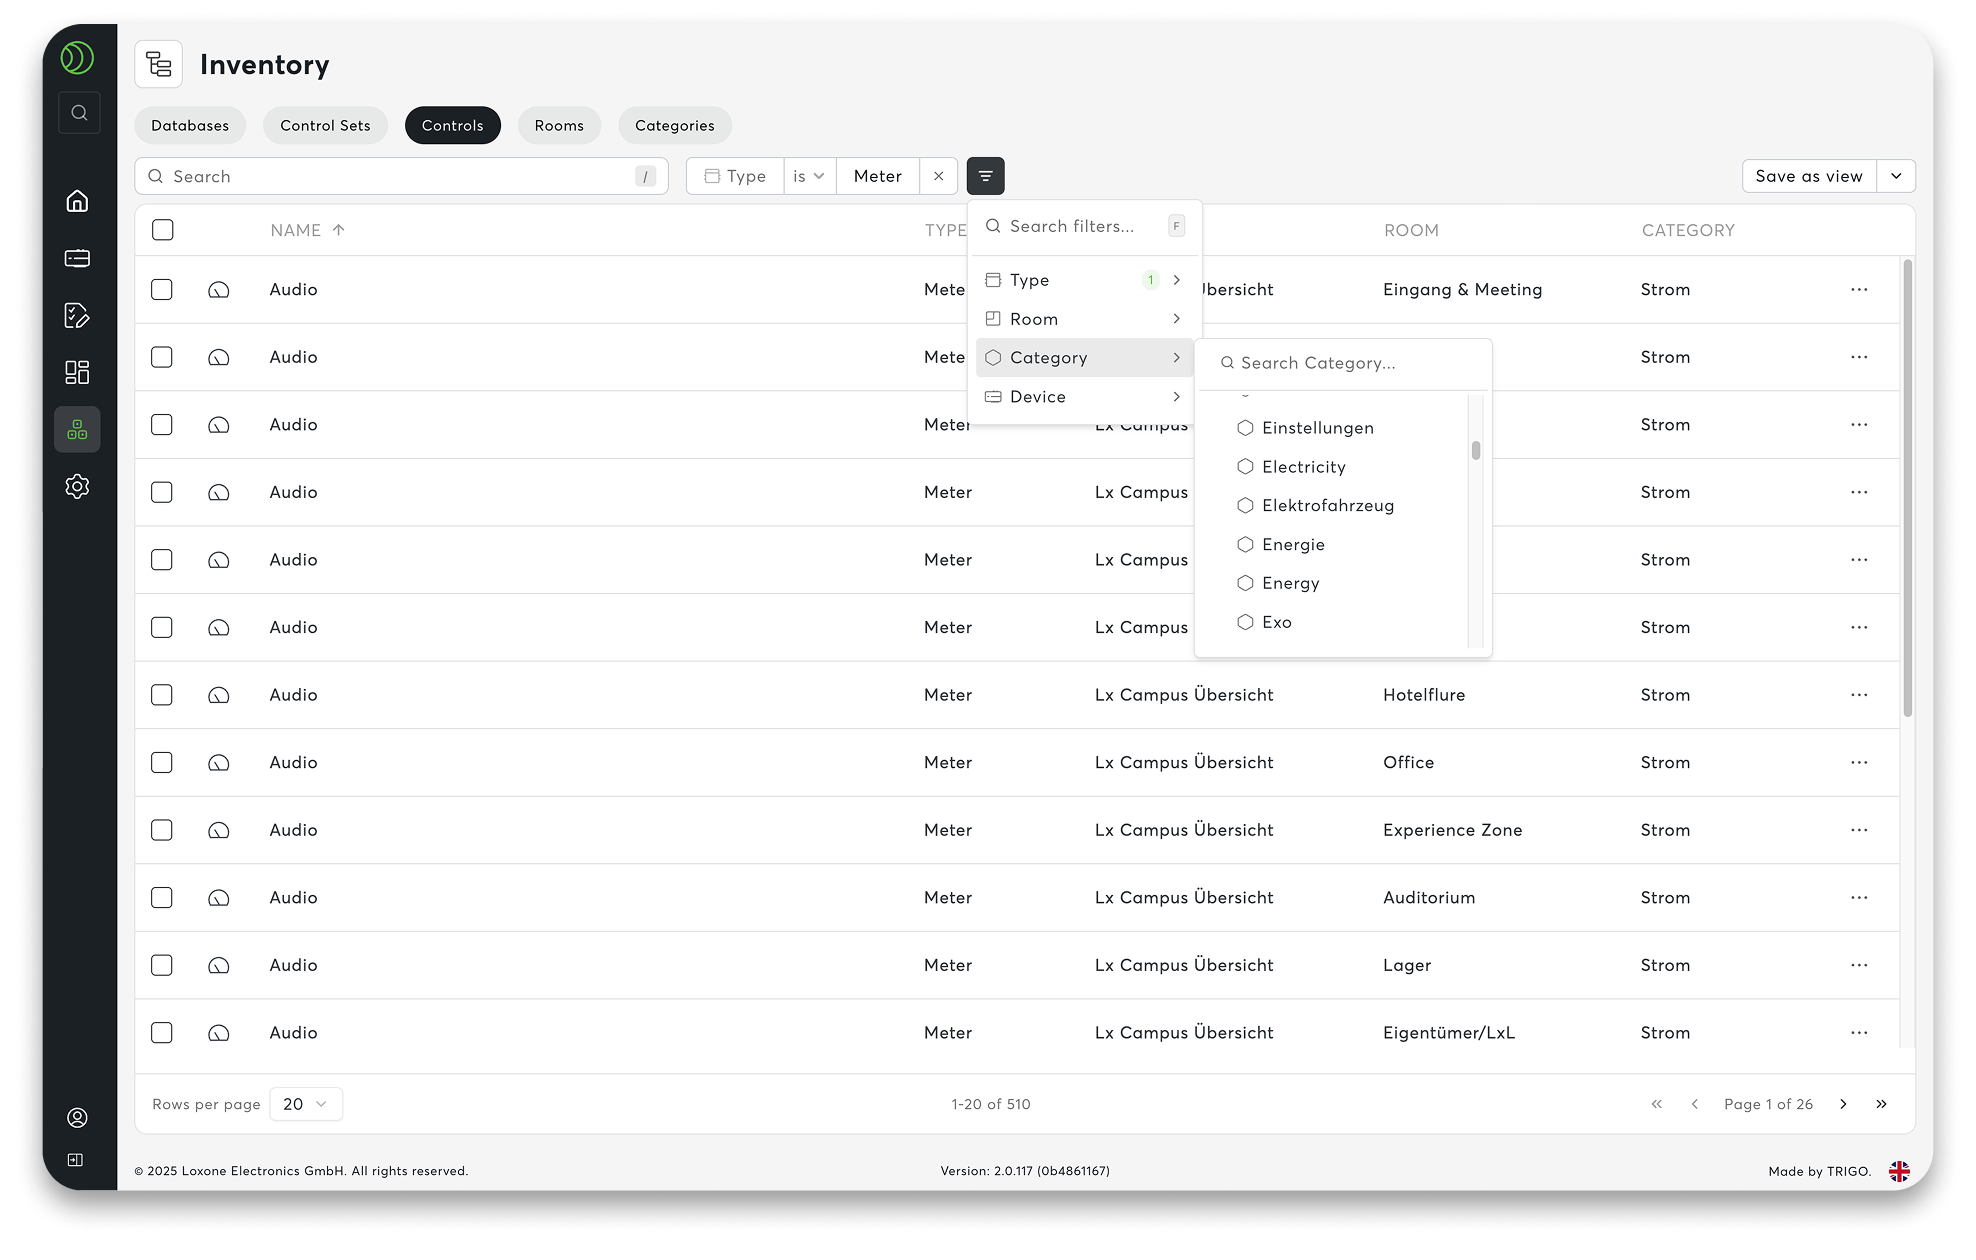
01 Control Sets – Dynamic Data Filters
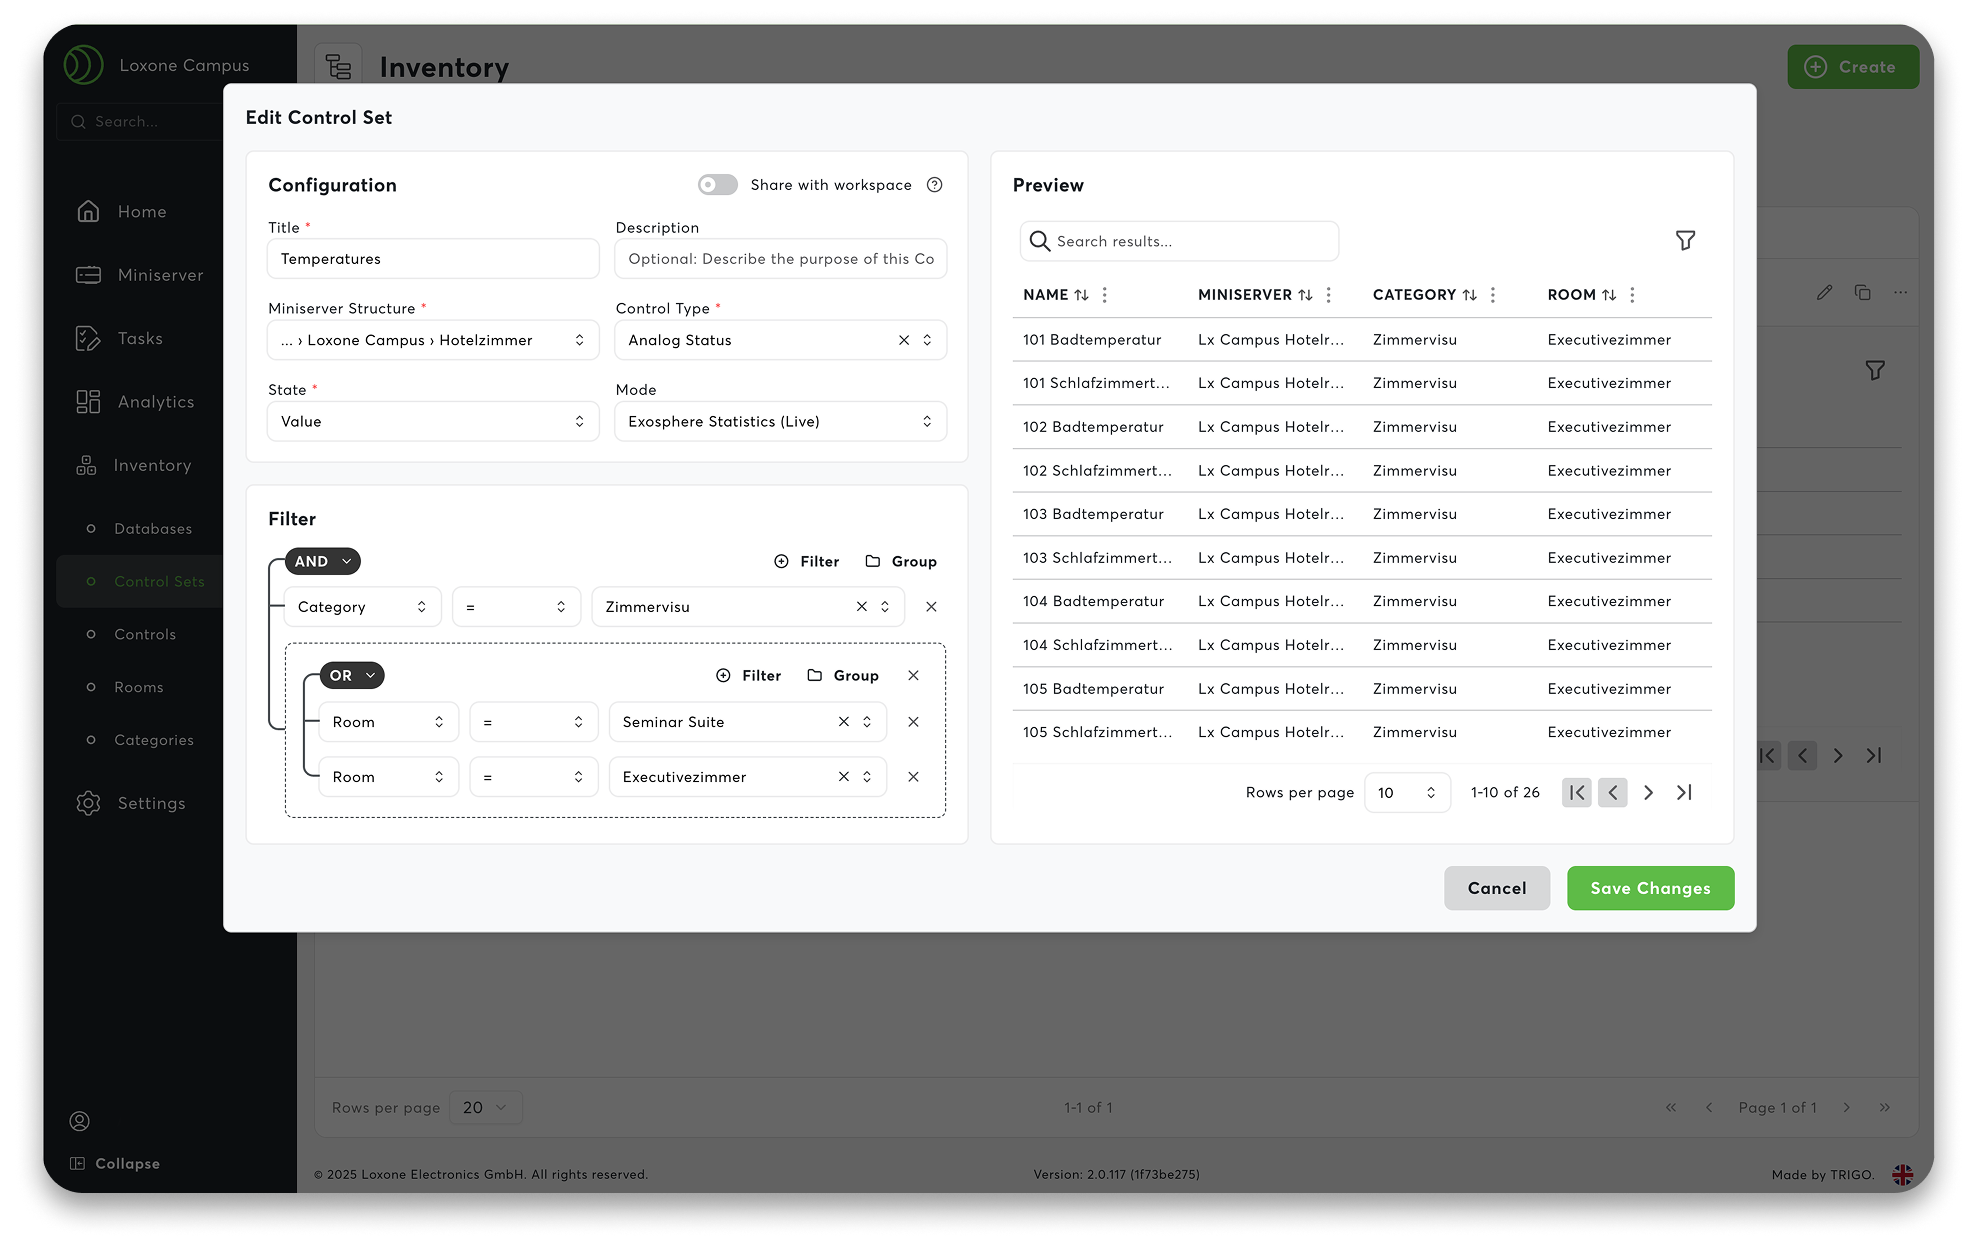
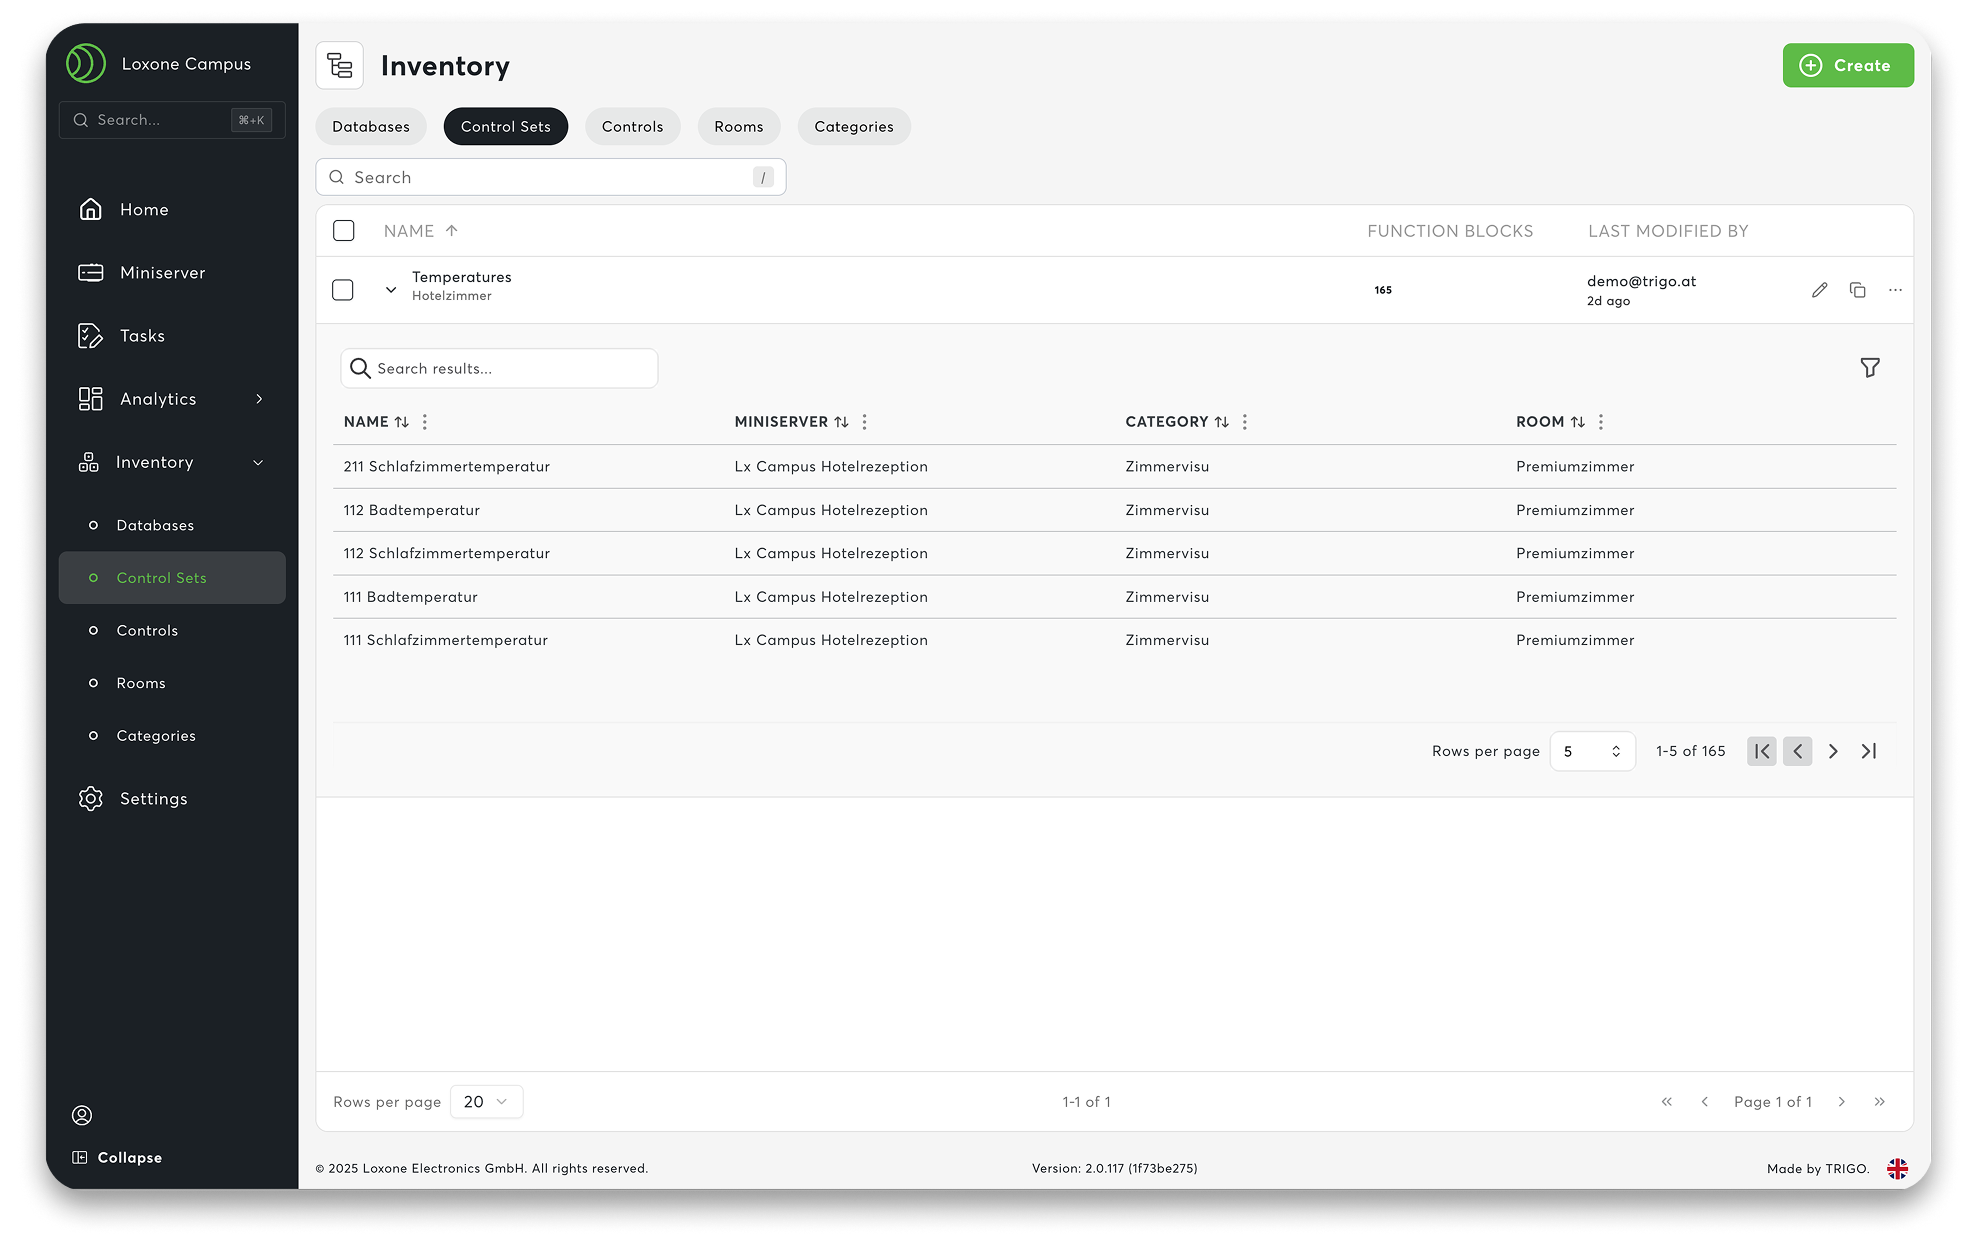
Control Sets ensure that your workspace remains calm and clear. Instead of maintaining data manually, you work with dynamic filters. They automatically recognize which devices and information are relevant to whom – based on user rights. You define the logic once, and the system does the rest in the background. This means that even large workspaces, such as those in supermarkets, franchises, or energy communities, remain permanently up to date.
Practical Examples:
- “All main meters in my region” – automatically correct for every regional manager.
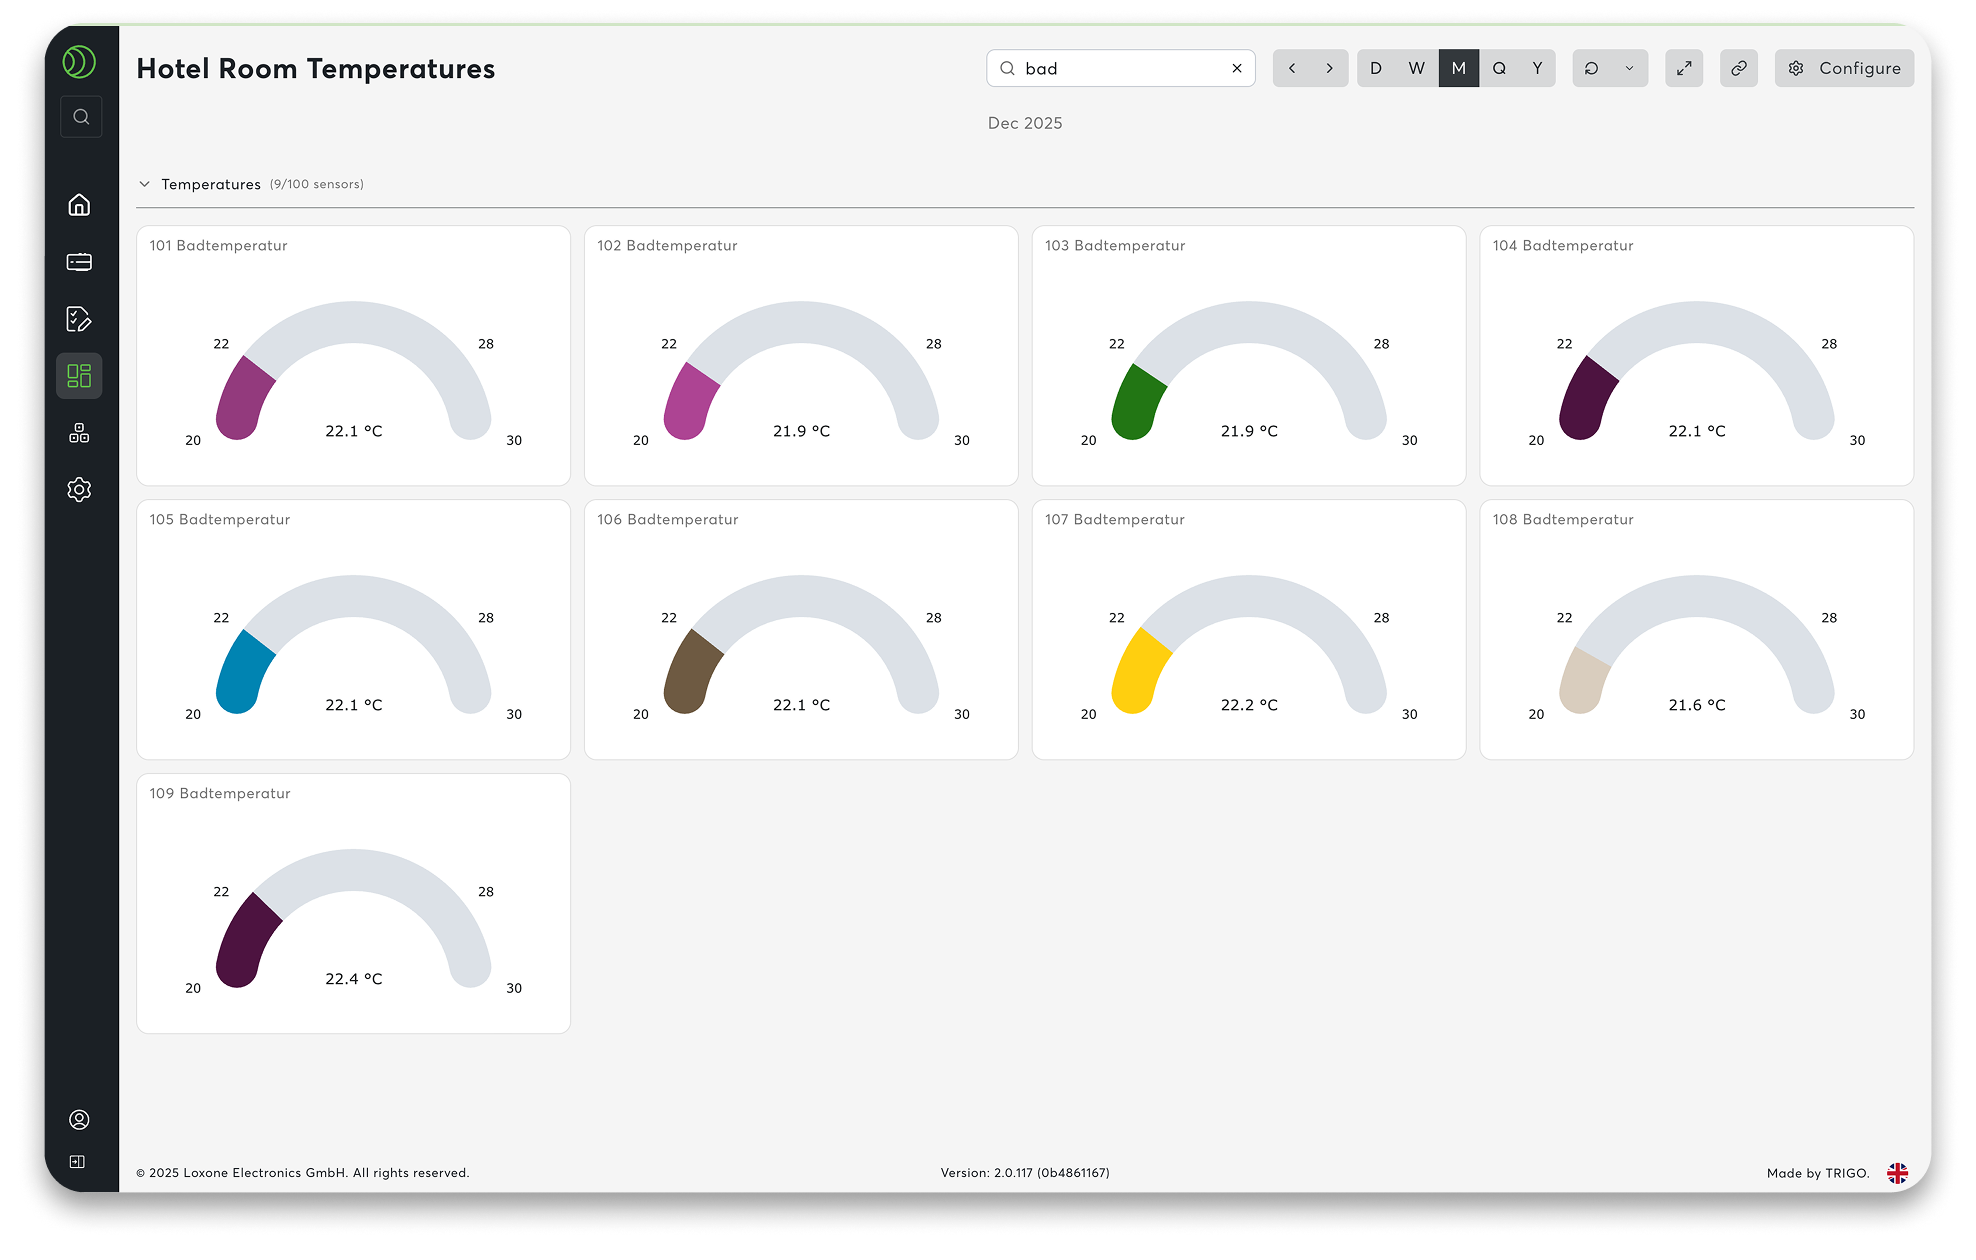
- “Temperature overview of all hotel rooms at the Loxone Campus” – always up to date, without any rework.
One filter. One system. And everything adapts accordingly.
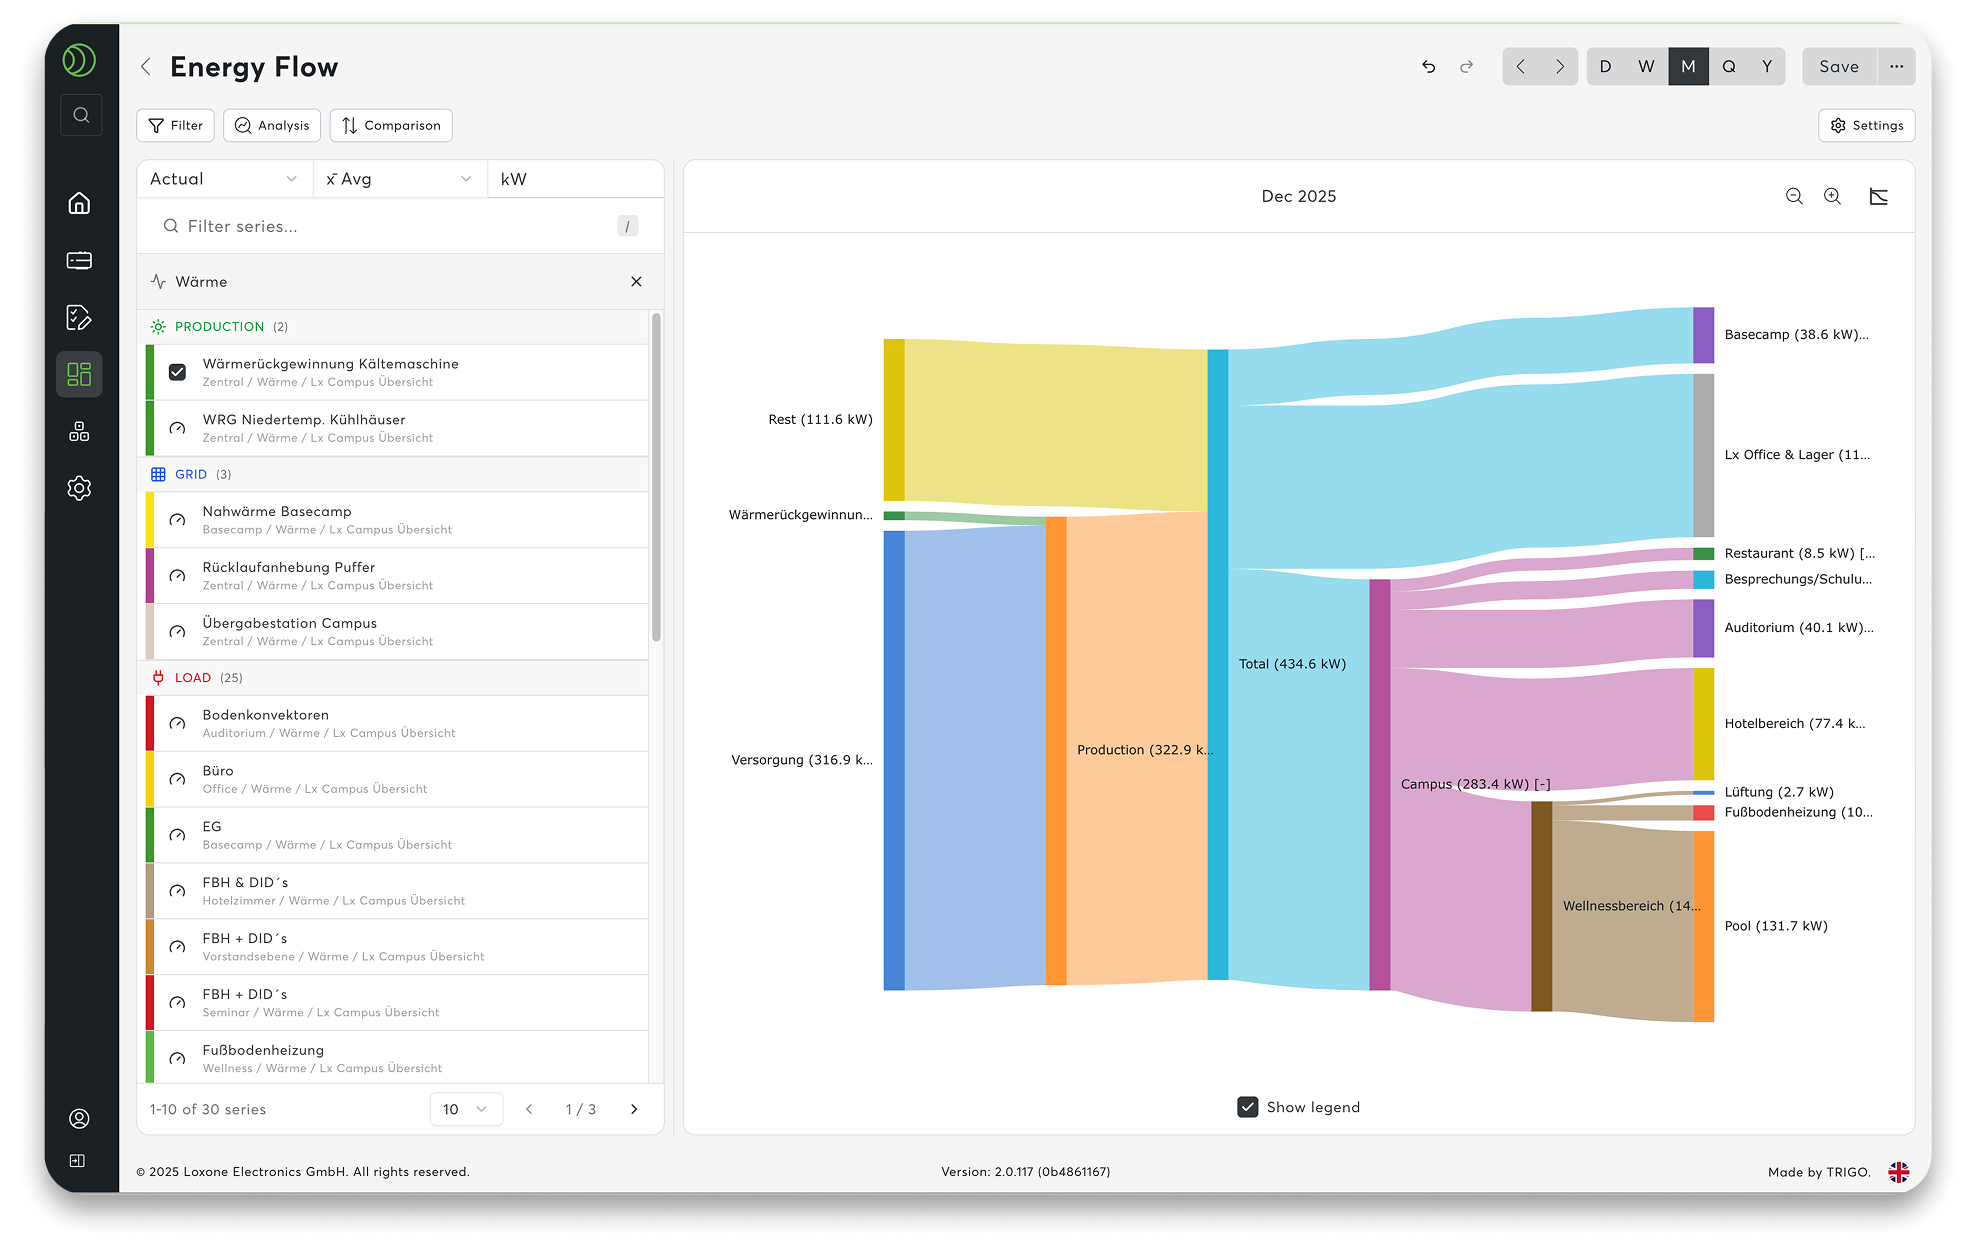
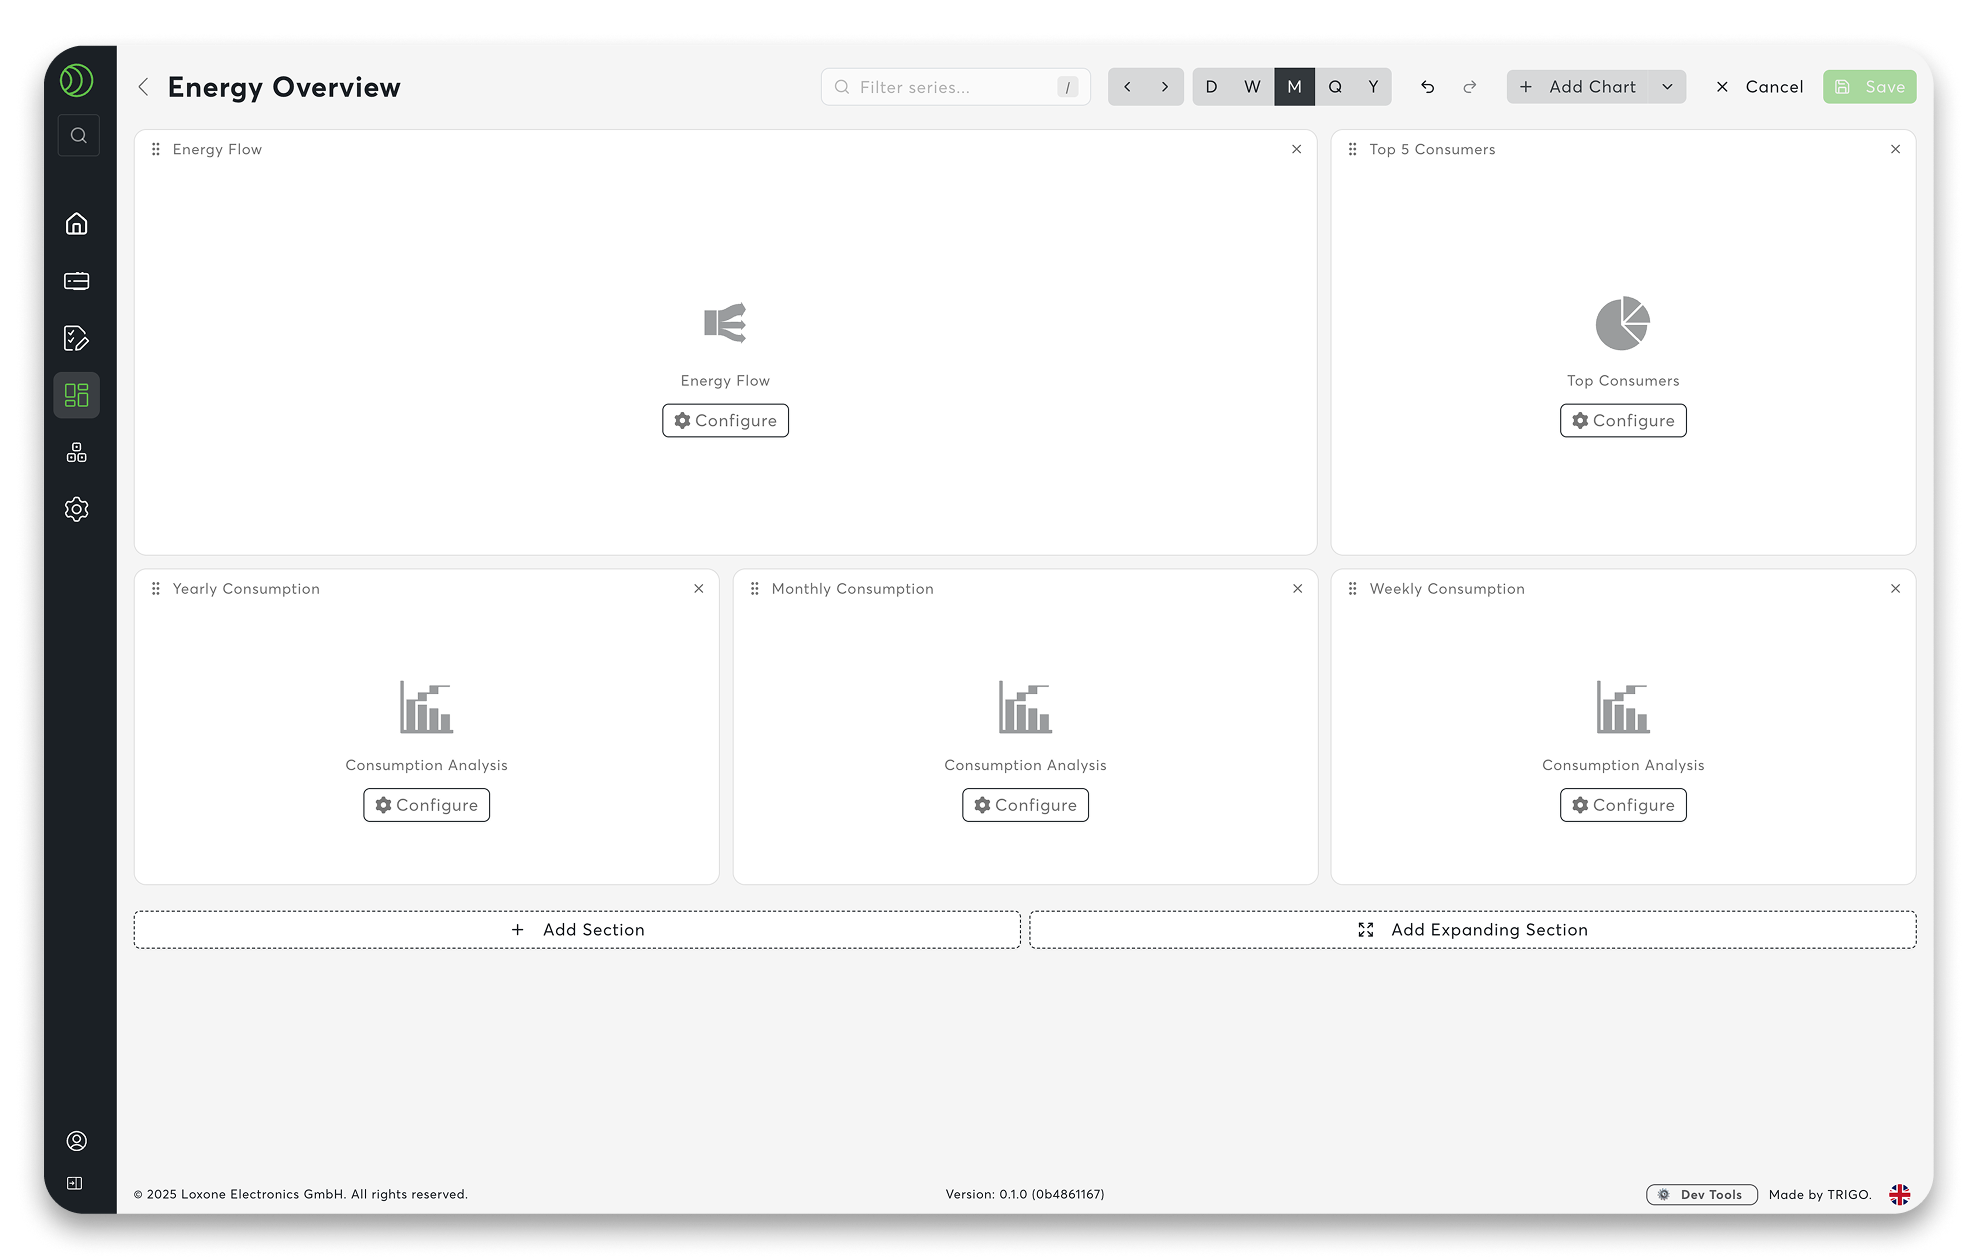
02 New Diagram and Charting System
- Top-Lists: Where is the most electricity or water consumed?
- Benchmarking: How do locations compare in a direct comparison?
- Target/actual comparisons:/strong>: Target values as reference lines – deviations are immediately visible.
- Intuitive Zoom: Allows you to navigate freely through large amounts of data.
Numbers become a real basis for decision-making.
03 Command Palette
Clicking on the search field in the navigation bar or using the shortcut STRG + K (or CMD + K on Mac) öopens a central command center. Type in what you’re looking for—a dashboard, a counter, a setting—and you’ll be there in no time. No detours through menus.
The search remembers what you need frequently.
Your everyday advantage:
- Everything in the workspace is accessible via keyboard.
- Quick access to dashboards, devices, charts, and workflows.
- Fewer clicks, more focus.
Navigation that feels easy.

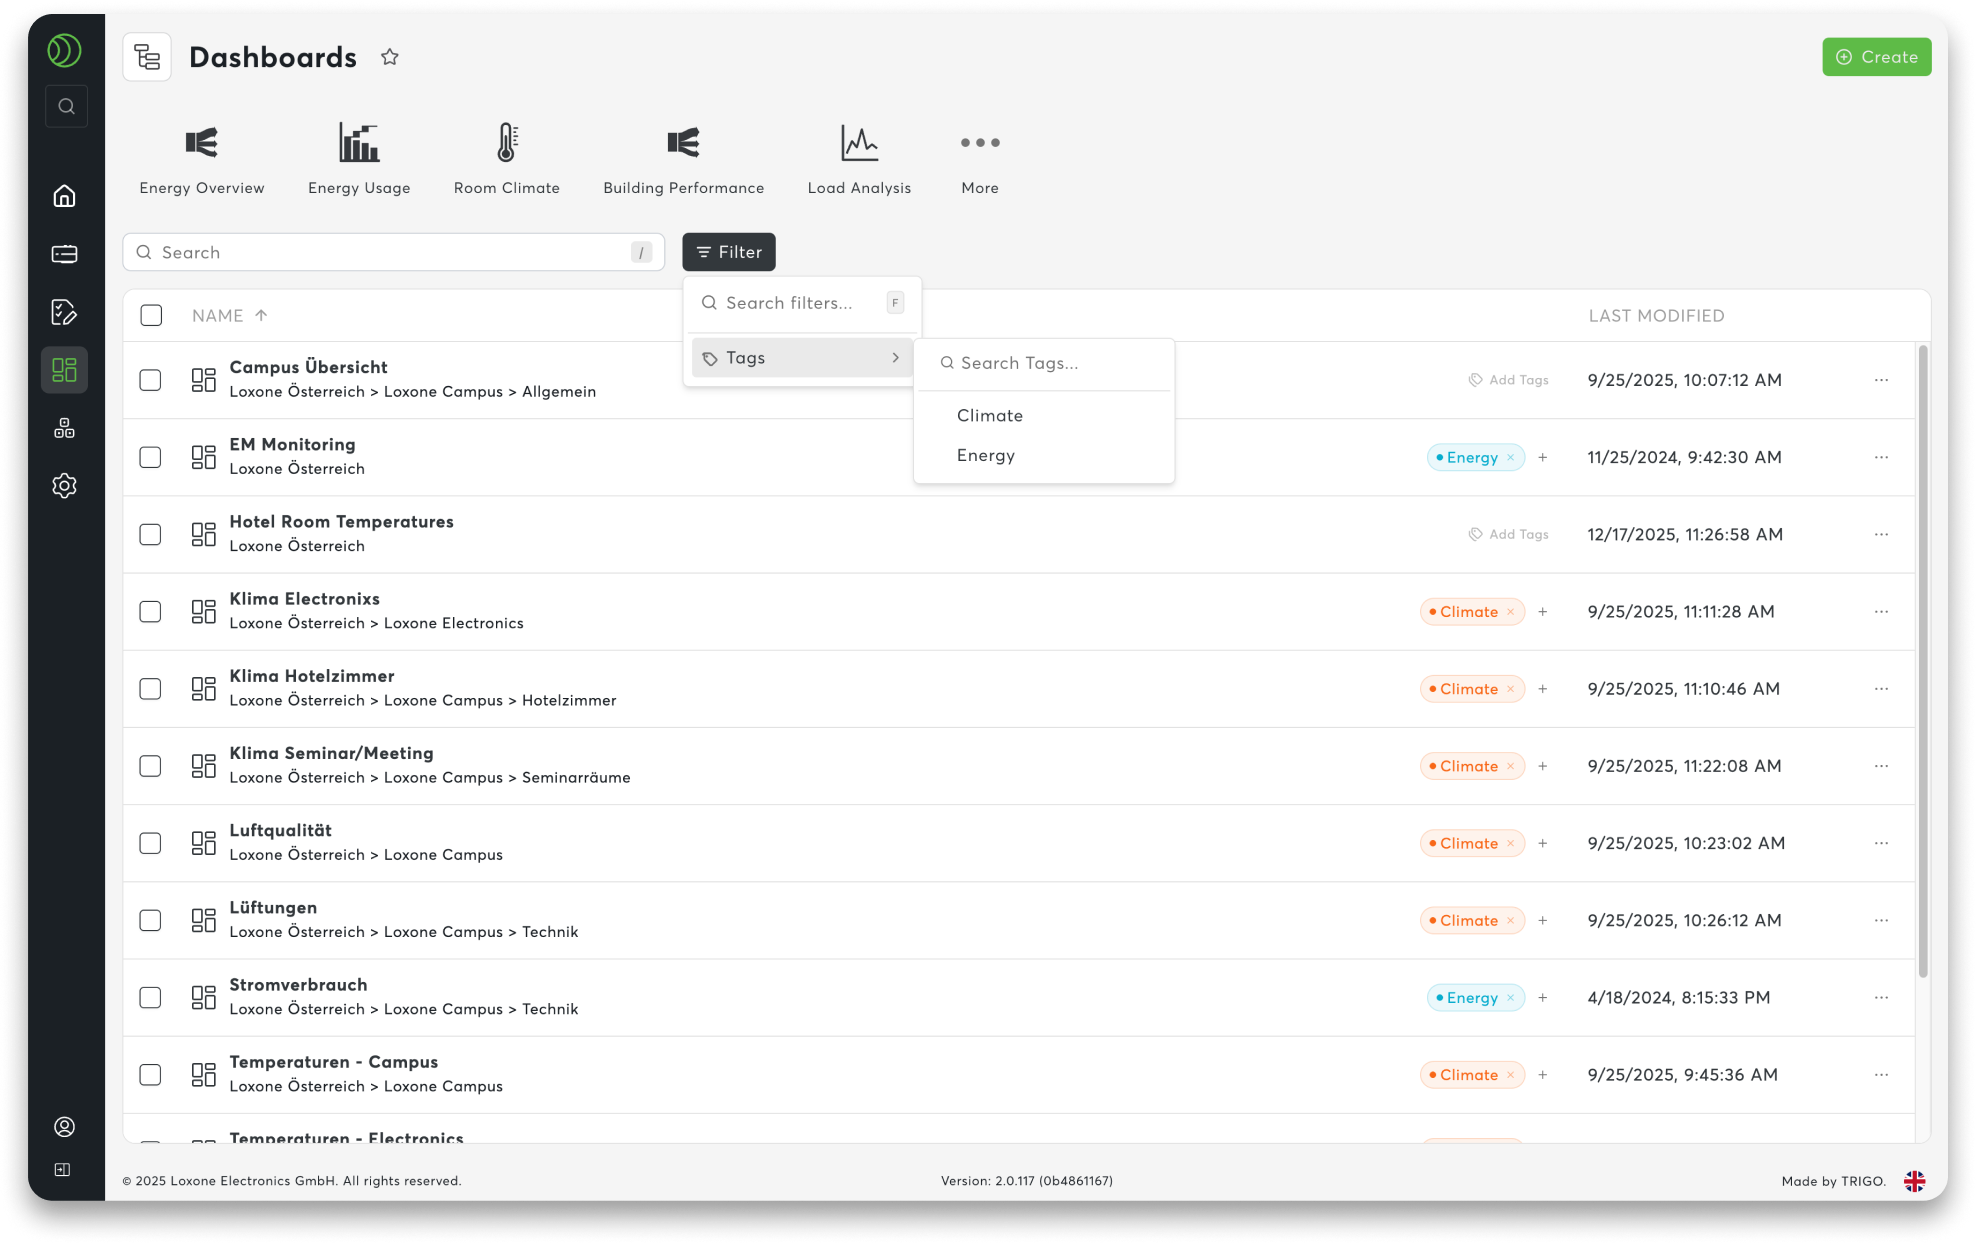
04 Tagging & Filter System
- Structure: Assign your own tags to content
- Filter: Search by topic instead of name
- Find: Tags and the command palette work together seamlessly
Your organization. Your overview. And a system that grows with you.
See For Yourself Now
Purchase License